In the landscape of business finance, few concepts are as fundamental yet as frequently confused as profit margin and gross margin. For entrepreneurs, managers, and investors, a clear, nuanced understanding of these two terms is not just accounting semantics—it’s a cornerstone of strategic decision-making. While both metrics shine a light on a company’s financial efficiency, they illuminate different parts of the profitability picture. Mistaking one for the other can lead to flawed analysis, poor pricing decisions, and misguided business strategies. This article delves into the distinct definitions, calculations, and applications of gross margin and profit margin, providing you with the knowledge to accurately diagnose financial health and drive sustainable growth.
What is Gross Margin?
Gross Margin, often expressed as a percentage, is a financial metric that reveals the proportion of money left over from revenues after accounting for the Cost of Goods Sold (COGS). It is the first and most direct measure of production efficiency and core profitability.
Calculation of Gross Margin
The calculation is straightforward:
Gross Margin = ((Revenue – Cost of Goods Sold) / Revenue) x 100
Cost of Goods Sold (COGS) includes all the direct, variable costs attributable to the production of the goods or services sold by a company. This typically encompasses:
-
Raw materials
-
Direct labor costs
-
Manufacturing supplies
-
Direct factory overhead (like utilities for the production facility)
The Strategic Role of Gross Margin
Gross margin serves as a critical indicator of a company’s production efficiency and pricing power. A high gross margin suggests that a company can produce its product at a relatively low cost or command a premium price. Conversely, a low or declining gross margin signals pressure from rising material costs, inefficient production, or competitive pricing pressures. It is a primary tool for evaluating the fundamental profitability of a product line or service before the burdens of the broader business operation are considered.
What is Profit Margin?
Profit Margin is a broader term that refers to the percentage of revenue that ultimately remains as profit after all expenses have been deducted from revenue. It is the definitive bottom-line metric of financial success. Importantly, there are several layers of profit margin, each providing a deeper level of insight.
Key Types of Profit Margin
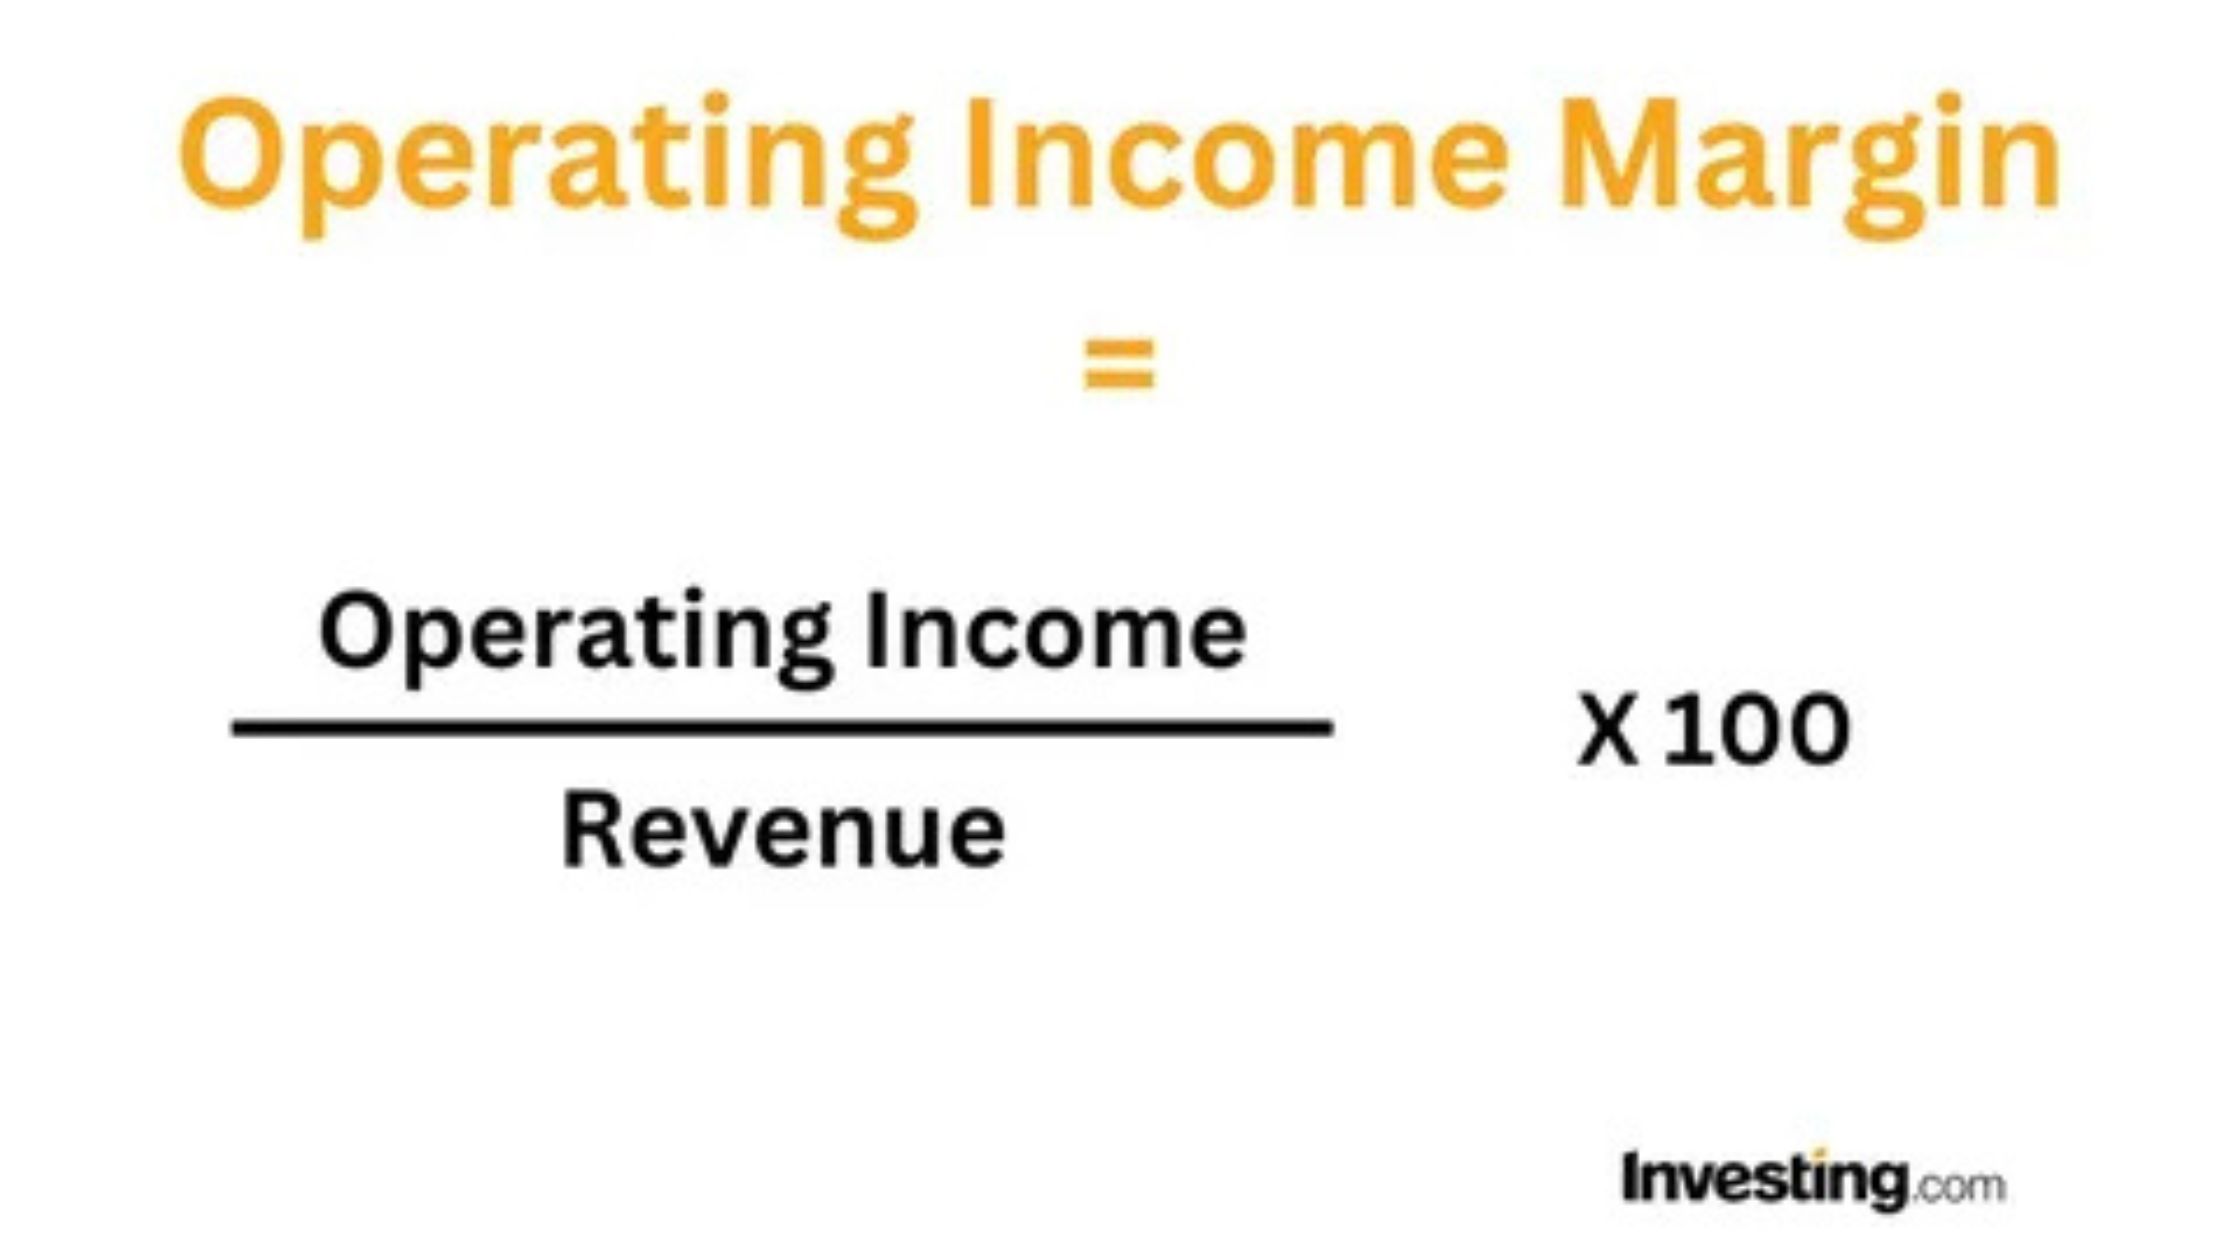
Operating Profit Margin
This metric considers all operating expenses, such as sales, marketing, research and development (R&D), and administrative costs.
Formula: ((Operating Income / Revenue) x 100)
Net Profit Margin
This is the most comprehensive margin. It accounts for all expenses, including operating expenses, interest on debt, taxes, and one-time extraordinary items.
Formula: ((Net Income / Revenue) x 100)
The Strategic Role of Profit Margin
Net profit margin is the ultimate barometer of a company’s overall management efficiency and financial health. It answers the question: “After paying for everything required to run this business, what percentage of each dollar earned is actual profit?” It reflects how well leadership controls both the cost of production (gross margin) and the cost of running the entire organization.
Gross Margin vs. Profit Margin: The Core Differences
While interconnected, these margins are distinct concepts serving different analytical purposes.
| Feature | Gross Margin | Profit Margin (Net) |
|---|---|---|
| Scope of Costs | Only direct production costs (COGS). | All costs: COGS, operating expenses, interest, taxes. |
| Primary Purpose | Measures production & core service efficiency. | Measures overall business efficiency & profitability. |
| Financial Statement | Derived from the Income Statement’s top section. | Derived from the bottom line (Net Income) of the Income Statement. |
| What it Answers | “How efficient is our production/pricing?” | “Is the entire business model financially viable?” |
| Influence | Heavily influenced by supply chain, production tech, and pricing. | Influenced by everything: production, management, debt structure, and tax strategy. |
A Simplified Illustrative Example
Imagine a company, “Alpha Manufacturing,” with $1,000,000 in annual revenue.
-
COGS (materials, factory labor): $400,000
-
Operating Expenses (salaries, marketing, rent): $300,000
-
Interest & Taxes: $100,000
Gross Margin Calculation:
Revenue ($1M) – COGS ($400k) = Gross Profit ($600k).
Gross Margin = ($600k / $1M) x 100 = 60%
Net Profit Margin Calculation:
Gross Profit ($600k) – OpEx ($300k) – Interest & Taxes ($100k) = Net Income ($200k).
Net Profit Margin = ($200k / $1M) x 100 = 20%
This example clearly shows that while Alpha retains 60 cents per dollar after production costs, only 20 cents ultimately flow to the bottom line after all other business obligations.
Why These Margins Matter for Business Strategy
Analyzing these margins in tandem provides a powerful framework for strategic decision-making.
For Pricing Strategy
-
Gross Margin helps set the minimum price floor. It ensures each sale covers its direct cost and contributes to overhead.
-
Net Profit Margin is the ultimate pricing target. It ensures the final price, after all costs, delivers the desired overall profitability.
For Cost Control and Efficiency
-
A declining Gross Margin typically points to issues in the supply chain or production process (e.g., supplier price hikes, labor inefficiencies).
-
A declining Net Profit Margin with a stable Gross Margin signals bloated operational or administrative expenses (e.g., excessive marketing spend, high corporate overhead).
For Financial Analysis and Investment
Investors scrutinize both. A strong, stable gross margin indicates a defensible competitive moat. A healthy and growing net profit margin demonstrates effective overall management and scalability, making the company a more attractive investment.
Industry Benchmarks: Context is Crucial
It is imperative to evaluate margins within an industry context. “Good” margins vary dramatically:
-
Software/SaaS: Often have very high gross margins (80-90%) because COGS (hosting fees) is low, but net margins are shaped by huge R&D and sales investments.
-
Retail/Grocery: Typically operate on razor-thin gross and net margins (often 2-5%), relying on massive volume and efficient inventory turnover.
-
Manufacturing: Margins depend on product complexity but are generally lower than software and higher than retail.
Comparing a retailer’s 3% net margin to a software company’s 25% net margin is not an apples-to-apples comparison. Benchmark against industry peers for meaningful insight.
Common Pitfalls and Misconceptions
-
Using the Terms Interchangeably: This is the most critical error. Confusing them can lead to severe miscalculations of business health.
-
Focusing on One Margin in Isolation: A company can have a stellar 70% gross margin but be unprofitable due to runaway operating expenses (resulting in a negative net margin).
-
Ignoring Trends: A single point-in-time margin is less informative than the trend over time. Are margins improving, deteriorating, or stable?
-
Over-Optimizing for One Margin: Slashing quality to improve gross margin can damage brand reputation. Aggressively cutting R&D to boost net margin can stifle long-term innovation.
How to Improve Your Margins
Strategies to Improve Gross Margin:
-
Negotiate with Suppliers: Seek better rates for raw materials or inventory.
-
Optimize Production: Implement lean manufacturing, reduce waste, and improve labor efficiency.
-
Review Pricing: Analyze if the market will bear a price increase without significantly reducing volume.
-
Product Mix Adjustment: Focus on selling higher-margin products or services.
Strategies to Improve Net Profit Margin:
-
Control Operating Expenses: Audit spending on marketing, administration, and logistics for efficiency gains.
-
Leverage Technology: Automate processes to reduce administrative and labor costs.
-
Refinance Debt: Secure lower interest rates to reduce finance costs.
-
Strategic Tax Planning: Work with financial advisors to ensure tax efficiency within legal bounds.
The Interplay in Decision-Making: A Holistic View
Effective leaders use both margins as complementary dials on the control panel. For instance:
-
Launching a new product requires analyzing its potential gross margin to ensure it’s viable.
-
Deciding whether to open a new office involves modeling how the added operating expenses will impact the company’s overall net profit margin.
They are not opposing forces but sequential filters that revenue must pass through to become true profit.
Conclusion
Profit margin and gross margin are two sides of the same coin, each providing an essential, distinct perspective on a company’s financial performance. Gross margin is the focused lens on production efficiency and core product profitability, isolating the direct costs of creation. Profit margin, particularly net profit margin, is the wide-angle lens that captures the entire financial picture, revealing how effectively the business converts revenue into ultimate earnings.
Mastering the difference is non-negotiable for sound financial management. By monitoring both metrics regularly, understanding their trends, and using them to inform strategic choices in pricing, cost control, and investment, business leaders can make precise, data-driven decisions that enhance resilience, foster growth, and ensure long-term financial sustainability. The path to robust profitability begins with clearly understanding where your money is made—and where it is spent.
Frequently Asked Questions (FAQs)
Q1: Can gross profit margin be higher than net profit margin?
A: Yes, always. Gross margin is calculated before subtracting operating expenses, taxes, and interest. Net profit margin is the final margin after all these costs, so it is invariably lower (or equal in a theoretical, zero-overhead scenario).
Q2: Which margin is more important for a startup?
A: Both are critical, but focus often shifts. Early on, gross margin is vital to prove the core product/service is economically viable. As the company scales, investor scrutiny intensifies on the path to a positive and growing net profit margin as proof of a sustainable business model.
Q3: How often should I calculate these margins?
A: At a minimum, calculate them monthly. For dynamic businesses or during critical periods, weekly or even real-time monitoring (using dashboards) can provide timely insights for quick corrective action.
Q4: What does it mean if my gross margin is high but my net margin is low?
A: This indicates a significant disconnect between production efficiency and operational spending. Your business is good at making its product cost-effectively but is spending too much on areas like marketing, sales, administration, or perhaps carrying high debt costs. An immediate review of operating expenses is warranted.
Q5: Are these margins relevant for service-based businesses?
A: Absolutely. For service businesses, COGS is often called “Cost of Revenue” or “Cost of Services” and includes direct labor for delivering the service, contractor costs, and any direct materials used. The same calculation principles apply: Gross Margin measures service delivery efficiency, and Net Profit Margin measures overall business health.